
← Back to Experience
Served as second-in-command for data analytics in Astara's newly launched Move department, a car subscription service managing over 1,000 active vehicles. Developed Python automation tools and web scraping solutions that transformed how the company made pricing decisions and prepared executive reports, reducing weekly report preparation time by over 90%.
Astara is a major automotive distributor handling over $5 billion in annual revenue. The Move department launched a subscription-based car rental service as an alternative to traditional car ownership, requiring sophisticated data analytics to compete in a crowded market.
As a newly launched department, Astara Move needed data-driven insights to guide fleet expansion decisions. I analyzed user subscription data to identify which vehicle models were most popular, helping inform purchasing decisions worth millions of dollars.
import pandas as pd
import numpy as np
from datetime import datetime

# Load subscription data from database
def analyze_vehicle_popularity(df):
    # Group by vehicle model and calculate key metrics
    popularity = df.groupby('vehicle_model').agg({
        'subscription_id': 'count',
        'subscription_duration': 'mean',
        'revenue': 'sum'
    })

    # Calculate utilization rate
    popularity['utilization_rate'] = (
        popularity['subscription_id'] /
        df.groupby('vehicle_model')['available_units'].first()
    )

    return popularity.sort_values('utilization_rate', ascending=False)

# Identify peak seasons
def find_peak_seasons(df):
    df['month'] = pd.to_datetime(df['start_date']).dt.month
    monthly_demand = df.groupby('month')['subscription_id'].count()

    return monthly_demand
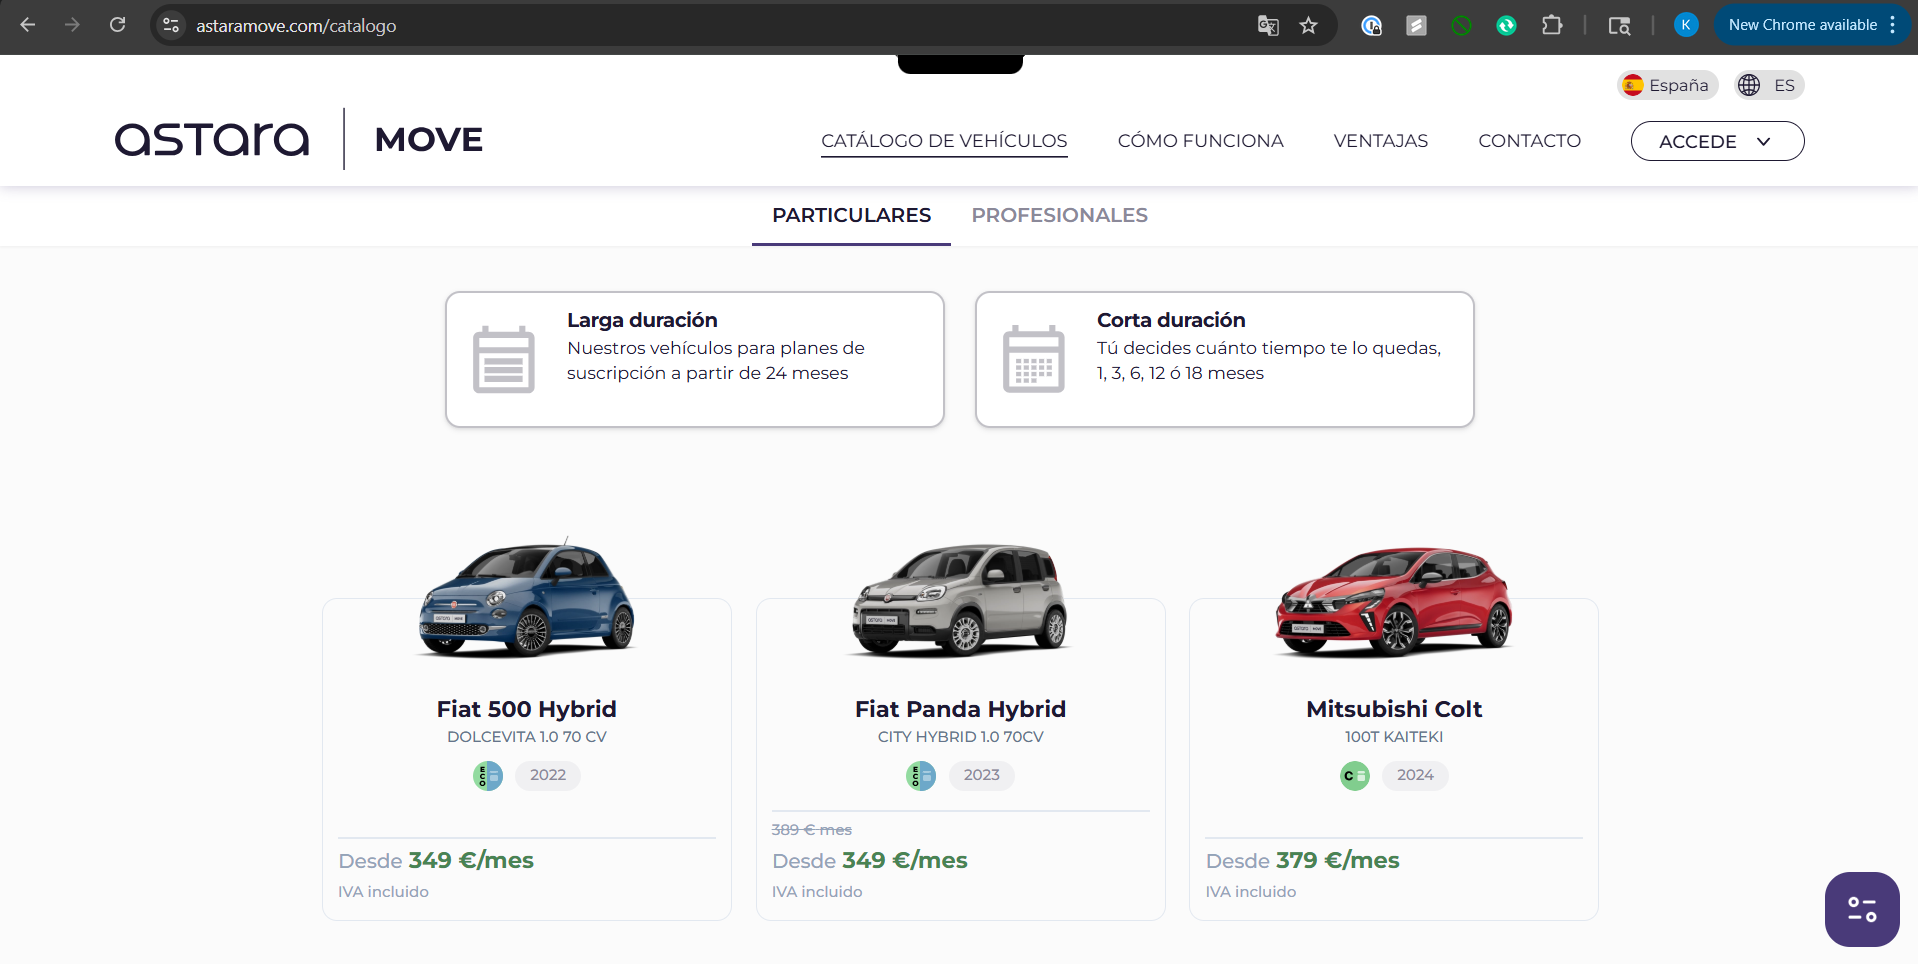
Developed a sophisticated web scraping system that automatically tracked competitor pricing across 1,000+ competitors. When Astara added a new vehicle model to their fleet, the system would immediately provide average subscription costs from all tracked competitors, enabling data-driven pricing strategies.
from selenium import webdriver
from selenium.webdriver.common.by import By
from bs4 import BeautifulSoup
import requests
import pandas as pd

class CompetitorPriceScraper:
    def __init__(self, competitors_list):
        self.competitors = competitors_list
        self.driver = webdriver.Chrome()

    def scrape_competitor(self, url, vehicle_model):
        try:
            self.driver.get(url)

            # Wait for dynamic content to load
            self.driver.implicitly_wait(5)

            # Extract pricing data
            price_element = self.driver.find_element(
                By.CLASS_NAME, 'subscription-price'
            )

            price = float(price_element.text.replace('€', '').replace(',', ''))

            return {
                'vehicle': vehicle_model,
                'competitor': url,
                'price': price,
                'timestamp': datetime.now()
            }

        except Exception as e:
            print(f"Error scraping {url}: {e}")
            return None

    def get_market_average(self, vehicle_model):
        prices = []

        for competitor in self.competitors:
            data = self.scrape_competitor(competitor, vehicle_model)
            if data:
                prices.append(data['price'])

        return {
            'average': np.mean(prices),
            'median': np.median(prices),
            'min': min(prices),
            'max': max(prices)
        }
Transformed the weekly executive reporting process from hours of manual data entry into an automated system that pulled data directly from databases and generated presentation-ready reports. This 90%+ time reduction allowed the team to focus on strategic analysis rather than data compilation.
import sqlite3
import pandas as pd
import matplotlib.pyplot as plt
from pptx import Presentation
from datetime import datetime, timedelta

class WeeklyReportGenerator:
    def __init__(self, db_path):
        self.conn = sqlite3.connect(db_path)

    def fetch_weekly_metrics(self):
        # Calculate date range for past week
        end_date = datetime.now()
        start_date = end_date - timedelta(days=7)

        query = """
            SELECT
                DATE(subscription_start) as date,
                COUNT(*) as new_subscriptions,
                SUM(revenue) as daily_revenue,
                AVG(customer_rating) as avg_rating
            FROM subscriptions
            WHERE subscription_start BETWEEN ? AND ?
            GROUP BY DATE(subscription_start)
        """

        return pd.read_sql_query(query, self.conn,
                                    params=(start_date, end_date))

    def generate_charts(self, data):
        # Create revenue trend chart
        plt.figure(figsize=(10, 6))
        plt.plot(data['date'], data['daily_revenue'], marker='o')
        plt.title('Weekly Revenue Trend')
        plt.xlabel('Date')
        plt.ylabel('Revenue (€)')
        plt.savefig('weekly_revenue.png')

    def create_presentation(self):
        prs = Presentation()

        # Add title slide
        title_slide = prs.slides.add_slide(prs.slide_layouts[0])
        title_slide.shapes.title.text = "Weekly Performance Report"

        # Add data slides automatically...
        # (Additional slide generation code)

        prs.save('weekly_report.pptx')
Identified and reported critical bugs in the Astara Move platform, including pricing discrepancies across different devices and platforms. These findings prevented potential revenue loss and improved customer experience.
Working at a major automotive distributor handling over $5 billion in annual revenue provided invaluable insights into large-scale operations:
This internship taught me the power of automation and data-driven decision making. By replacing manual processes with automated systems, I helped a small team manage a rapidly growing operation without proportionally increasing workload. The 90% reduction in report preparation time demonstrated that thoughtful automation isn't just about saving time—it's about enabling teams to focus on high-value strategic work.
Working with a newly launched department showed me the importance of building scalable systems from the start. The web scraping and analytics tools I developed continue to provide value as the fleet grows beyond 1,000 vehicles, proving that good engineering creates lasting impact.
Perhaps most importantly, I learned that effective data analysis isn't just about writing code—it's about understanding business needs and translating them into actionable insights. Every script I wrote solved a real business problem, and seeing executives make million-dollar fleet decisions based on my analysis reinforced the real-world impact of data science.
← Back to All Experience